Charts
Total Customers
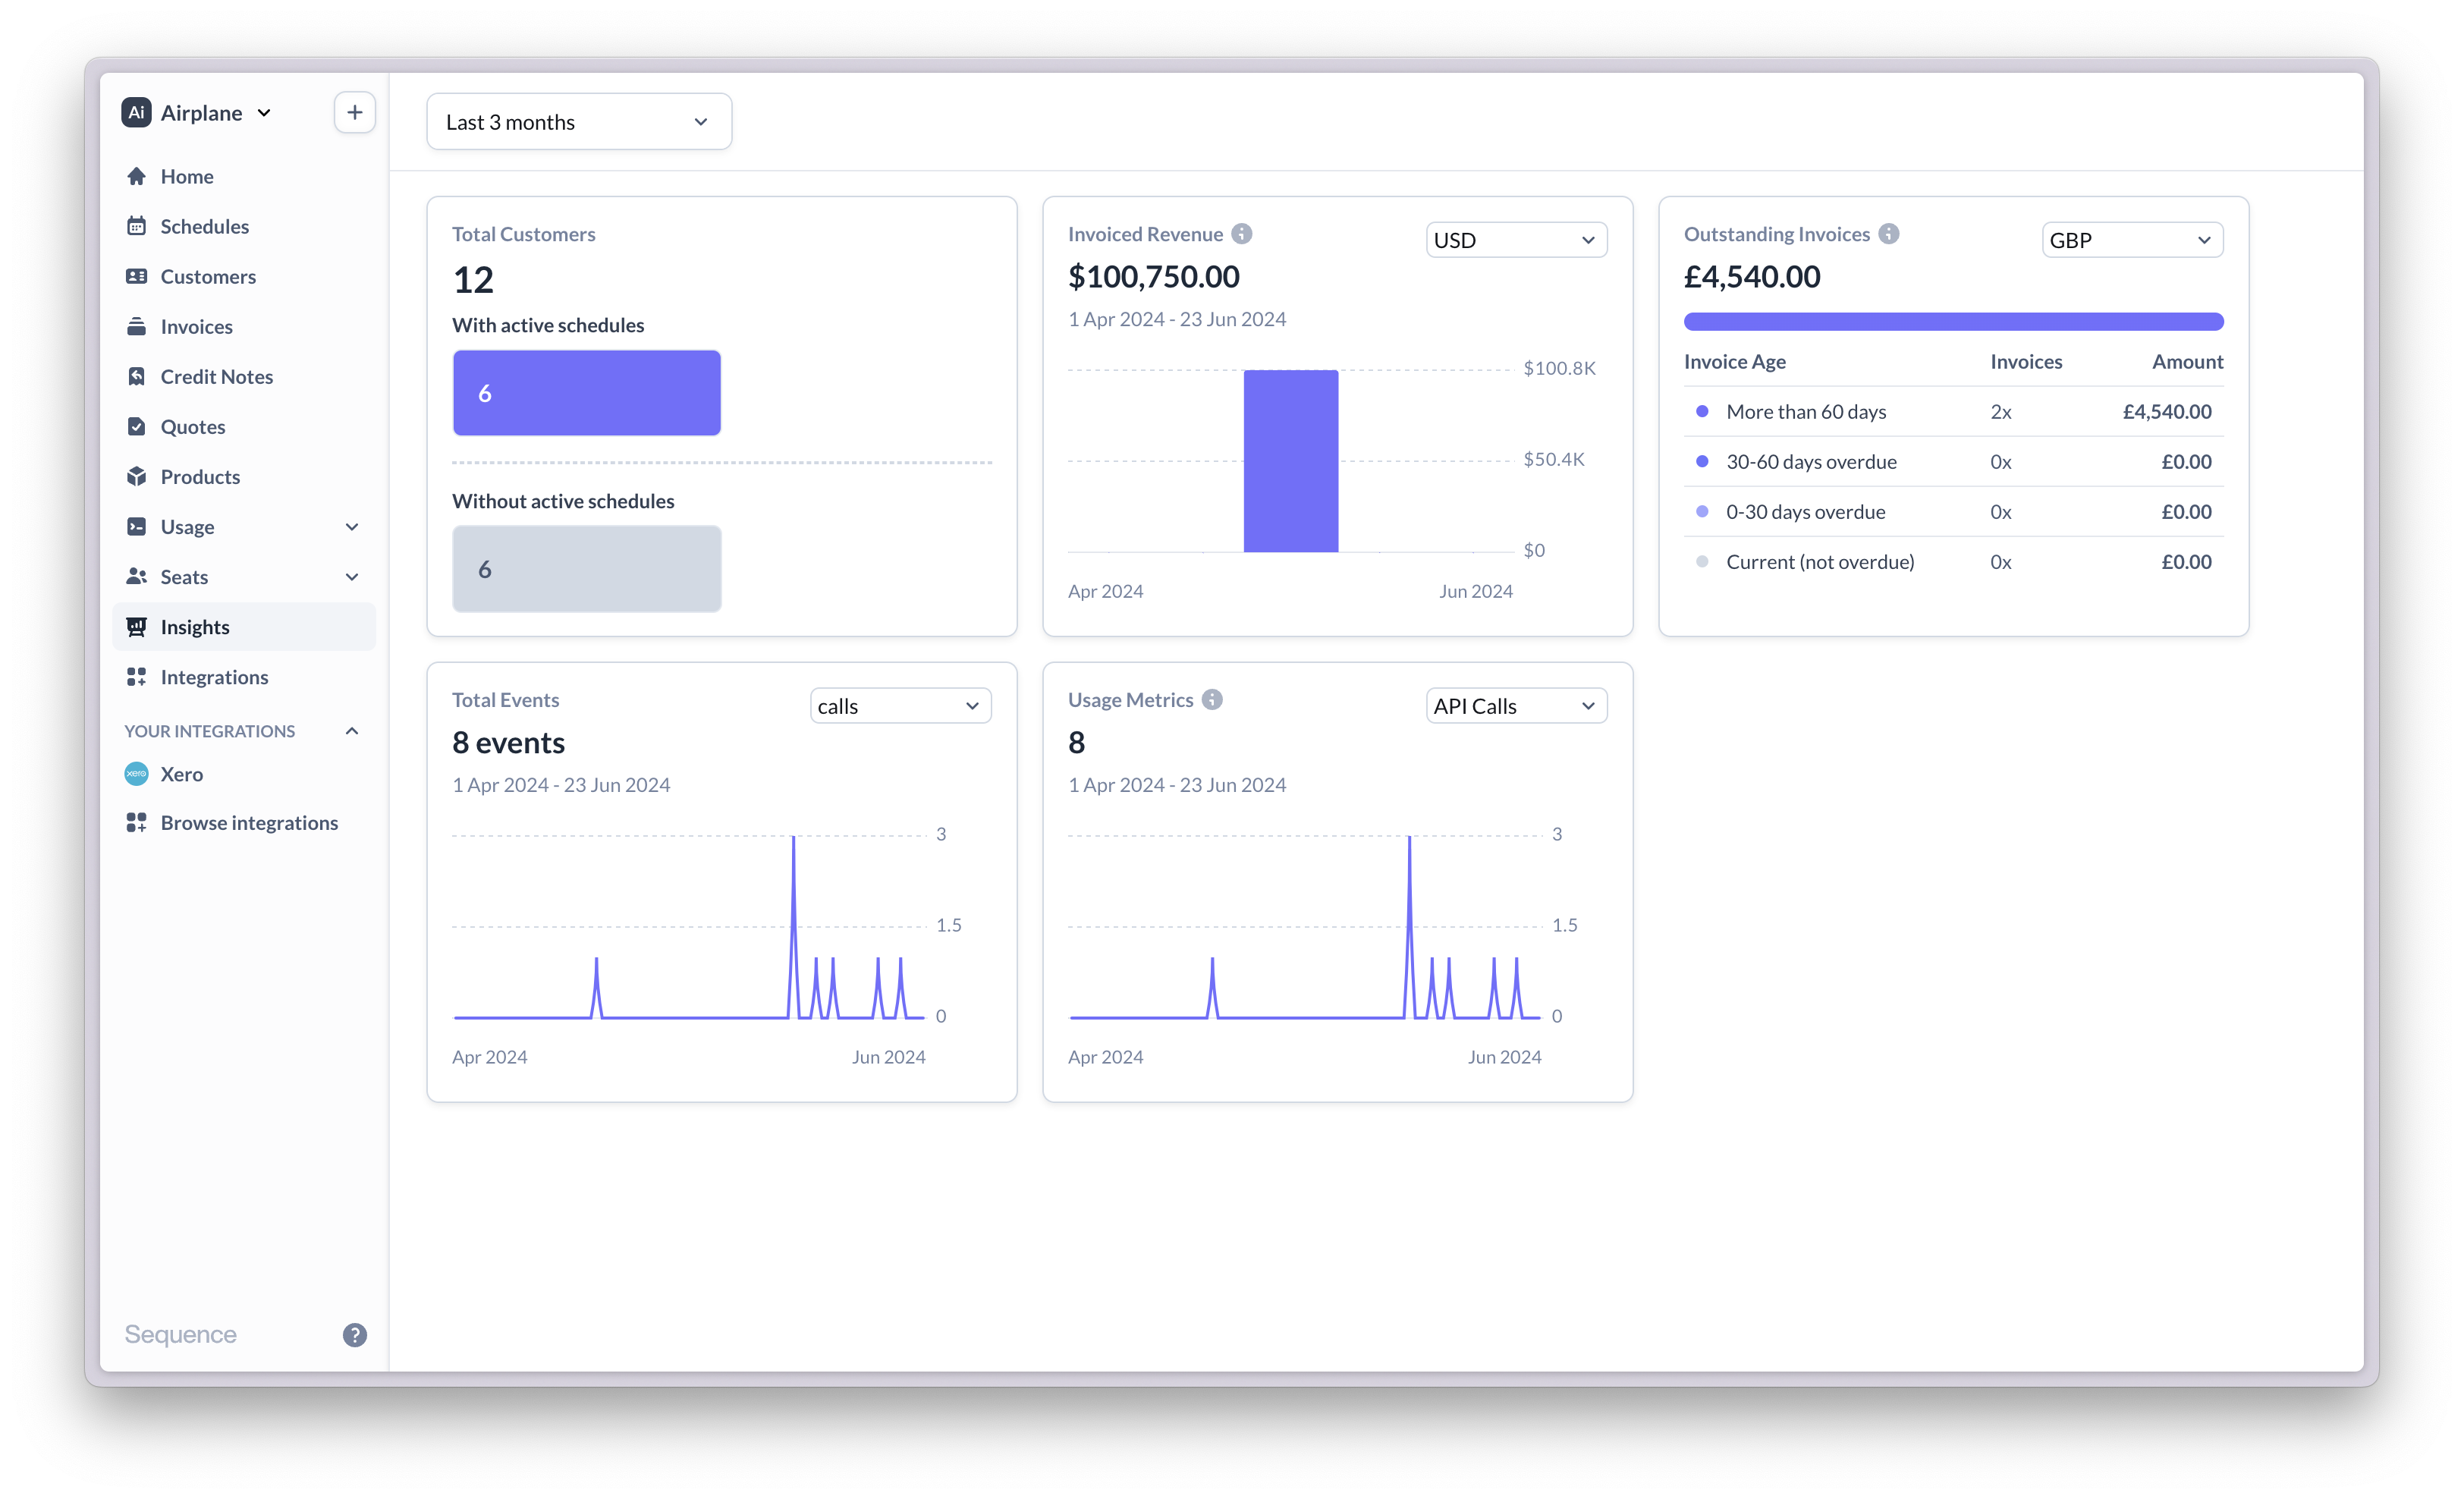
Total Customers
Number of customers with/without an active billing schedule. Hover over customers
without a billing schedule to see a breakdown between customers that never had
an active billing schedule and ones that were billed in the past but are no longer billed.
Invoiced Revenue
Invoiced Revenue
Total gross invoiced amount across all customers, by month. Segmented by currency.
Outstanding Invoices
Outstanding Invoices
Breakdown of outstanding invoices by aging bucket. Click on a row to get a list of invoices
in the bucket. Segmented by currency.
Total Events
Total Events
Total number of usage events across all customers, by day. Segmented by event type.
Usage Metrics
Usage Metrics
Total usage metric value across all customers, by day. Segmented by usage metric.